epistasis
A Python API for modeling statistical, high-order epistasis in genotype-phenotype maps. You can use this library to:
Decompose genotype-phenotype maps into high-order epistatic interactions
Find nonlinear scales in the genotype-phenotype map
Calculate the contributions of different epistatic orders and
Estimate the uncertainty in the epistatic coefficients and
For more information about the epistasis models in this library, see our Genetics paper:
This library is built on top of well known tools in the scientific Python stack. It uses packages like matplotlib, numpy, scipy, scikit-learn, and pandas. We strive to follow similar inferface designs present in this ecosytem. If you notice ways we can improve, please open an issue on Github! We’d love to hear your feedback.
Currently, this package works only as an API. There is no command-line interface. Instead, we encourage you use this package inside Jupyter notebooks .
Basic Example
Fit an epistasis model to genotype-phenotype map data.
# Import a model and the plotting module
from gpmap import GenotypePhenotypeMap
from epistasis.models import EpistasisLinearRegression
from epistasis.pyplot import plot_coefs
# Genotype-phenotype map data.
wildtype = "AAA"
genotypes = ["ATT", "AAT", "ATA", "TAA", "ATT", "TAT", "TTA", "TTT"]
phenotypes = [0.1, 0.2, 0.4, 0.3, 0.3, 0.6, 0.8, 1.0]
# Create genotype-phenotype map object.
gpm = GenotypePhenotypeMap(wildtype=wildtype,
genotypes=genotypes,
phenotypes=phenotypes)
# Initialize an epistasis model.
model = EpistasisLinearRegression(order=3)
# Add the genotype phenotype map.
model.add_gpm(gpm)
# Fit model to given genotype-phenotype map.
model.fit()
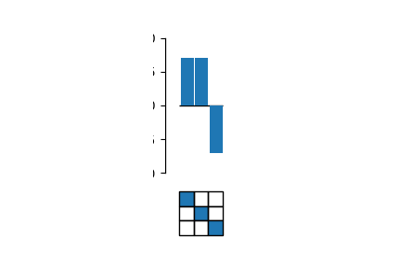
# Plot coefs.
fig, axes = plot_coefs(model, figsize=(2,4))
Documentation
We are still working hard on the Docs! You may notice blank spots in various places. We appreciate your patience as we try to catch up on docs.