High-order epistasis model
Estimate high-order epistatic coefficients in arbitrary genotype-phenotype maps. A linear epistasis model fits high-order interaction terms to capture variation in phenotype.
# Imports
import matplotlib.pyplot as plt
from gpmap import GenotypePhenotypeMap
from epistasis.models import EpistasisLinearRegression
from epistasis.pyplot import plot_coefs
# The data
wildtype = "000"
genotypes = ['000', '001', '010', '011', '100', '101', '110', '111']
phenotypes = [ 0.366, -0.593, 1.595, -0.753, 0.38 , 1.296, 1.025, -0.519]
gpm = GenotypePhenotypeMap(wildtype, genotypes, phenotypes)
# Initialize a model
model = EpistasisLinearRegression(order=3)
model.add_gpm(gpm)
# Fit the model
model.fit()
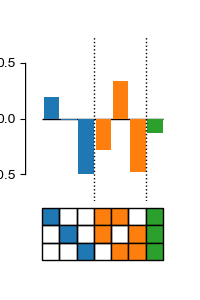
fig, ax = plot_coefs(model, figsize=(2,3))
plt.show()
Total running time of the script: ( 0 minutes 0.719 seconds)